Abstract
Background: Current literature lacks analysis of the interventional radiology workforce’s distribution in the United States. To characterize the geographic distribution of the interventional radiology workforce in the United States and to determine if there is a disparity in the geographic distribution of interventional radiologists in the rural–urban–metropolitan continuum. This project also resulted in the creation of an interactive map that may be utilized by interventional radiologists to screen for underserved areas to practice.
Methods: This retrospective study identified all interventional radiologists participating in Medicare’s Fee-for-Service program. Each interventional radiologist’s practice location was then matched to its respective county. Each county was classified as either rural, urban, or metropolitan based on a standardized classification system provided by the United States Department of Agriculture Economic Research Service known as Rural–Urban Continuum Codes. All counties were linked to population-level metrics provided by the Census Bureau. Finally, predetermined metrics were calculated: interventional radiologist density per 100 000, total population, and the total number of interventional radiologists in each county type.
Results: There are a total of 3142 counties in the United States. Among them, 1165 are metropolitan counties, 1332 are urban counties, and 644 are rural counties. Interventional radiologists are absent from 485 metropolitan counties, 957 urban counties, and 587 rural counties. There are 1.37 interventional radiologists per 100 000 people in metropolitan counties, 0.81 interventional radiologists per 100 000 in urban counties, and 0.57 interventional radiologists per 100 000 in rural counties.
Conclusion: The data suggest a disparity in the geographic distribution of interventional radiologists across the rural–urban continuum in the United States. The interactive map may serve as a tool to help normalize the distribution of interventional radiologists.
Keywords
Interventional radiology; Rural; Underserved
Article text
Introduction
Public health advances over the last century have significantly improved health in the United States. As a result, people are living longer, and the population is aging. This is supported by data from the Centers for Medicare and Medicaid Services (CMS), which showed an enrollment increase from 45.5 to 60 million people in Medicare.1 As the population continues to age, the role of interventionalists has and will continue to become prominent. Interventionalists can provide patients with various cost-effective, minimally invasive treatments.
Furthermore, as patients age, they become less ideal and, in many cases, poor candidates for surgery. For these patients, minimally invasive alternatives can provide life-altering solutions—with the caveat that they have access to interventional radiologists (IRs). There has been a recent increase in interest in interventional radiology (IR) and IRs have also seen an increase in radiology workforce marketshare from 8.4% in 2012 to 12.5% in 2018.2 Although the number of IRs has increased, it is unclear how they are distributed throughout the country. Therefore, this study aims to characterize the geographic distribution of IRs in the United States.
Materials and Methods
This study was exempt from Institutional Board Review approval. A retrospective analysis was performed using the Physician Compare National Downloadable File (PCNDF) provided by CMS for 2018. The PCNDF file contains information on all physicians participating in CMS fee-for-service. Physicians were identified as IRs if their primary specialty was labeled as “Interventional Radiology” or if their primary specialty was labeled as “Diagnostic Radiology” with a secondary specialty of “Interventional Radiology.”
Physicians were then organized by location via Zone Improvement Plan (ZIP) codes matched to their respective counties via Federal Information Processing Standards (FIPS) codes, which are unique 5-digit identifiers given to all counties in the United States. Zone Improvement Plan codes were matched to FIPS codes through the linkage of a database provided by the United States Department of Agriculture (USDA) and a database provided by the Office of Policy Development and Research.3,4
Once each physician was assigned to their respective counties with associated 2018 Census Bureau data, each county was then categorized using a standardized classification system provided by the USDA Economic Research Service known as Rural–Urban Continuum Codes (RUCCs). As summarized in Table 1, RUCCs distinguish counties based on population size and relative location.5 Rural–Urban Continuum Codes 1-3 were classified as metropolitan, 4-7 as urban (non-metropolitan), and 8-9 as rural.
Some physicians may provide coverage to multiple counties, and the PCDNF database allows physicians to list multiple practice locations. Therefore, it was necessary to standardize the number of physicians in each county. To this end, it was assumed that each physician provided equal coverage to each listed practice location. For example, if a physician listed 2 practice locations in 2 different counties, then each respective county was considered to have 0.5 physicians practicing in each.
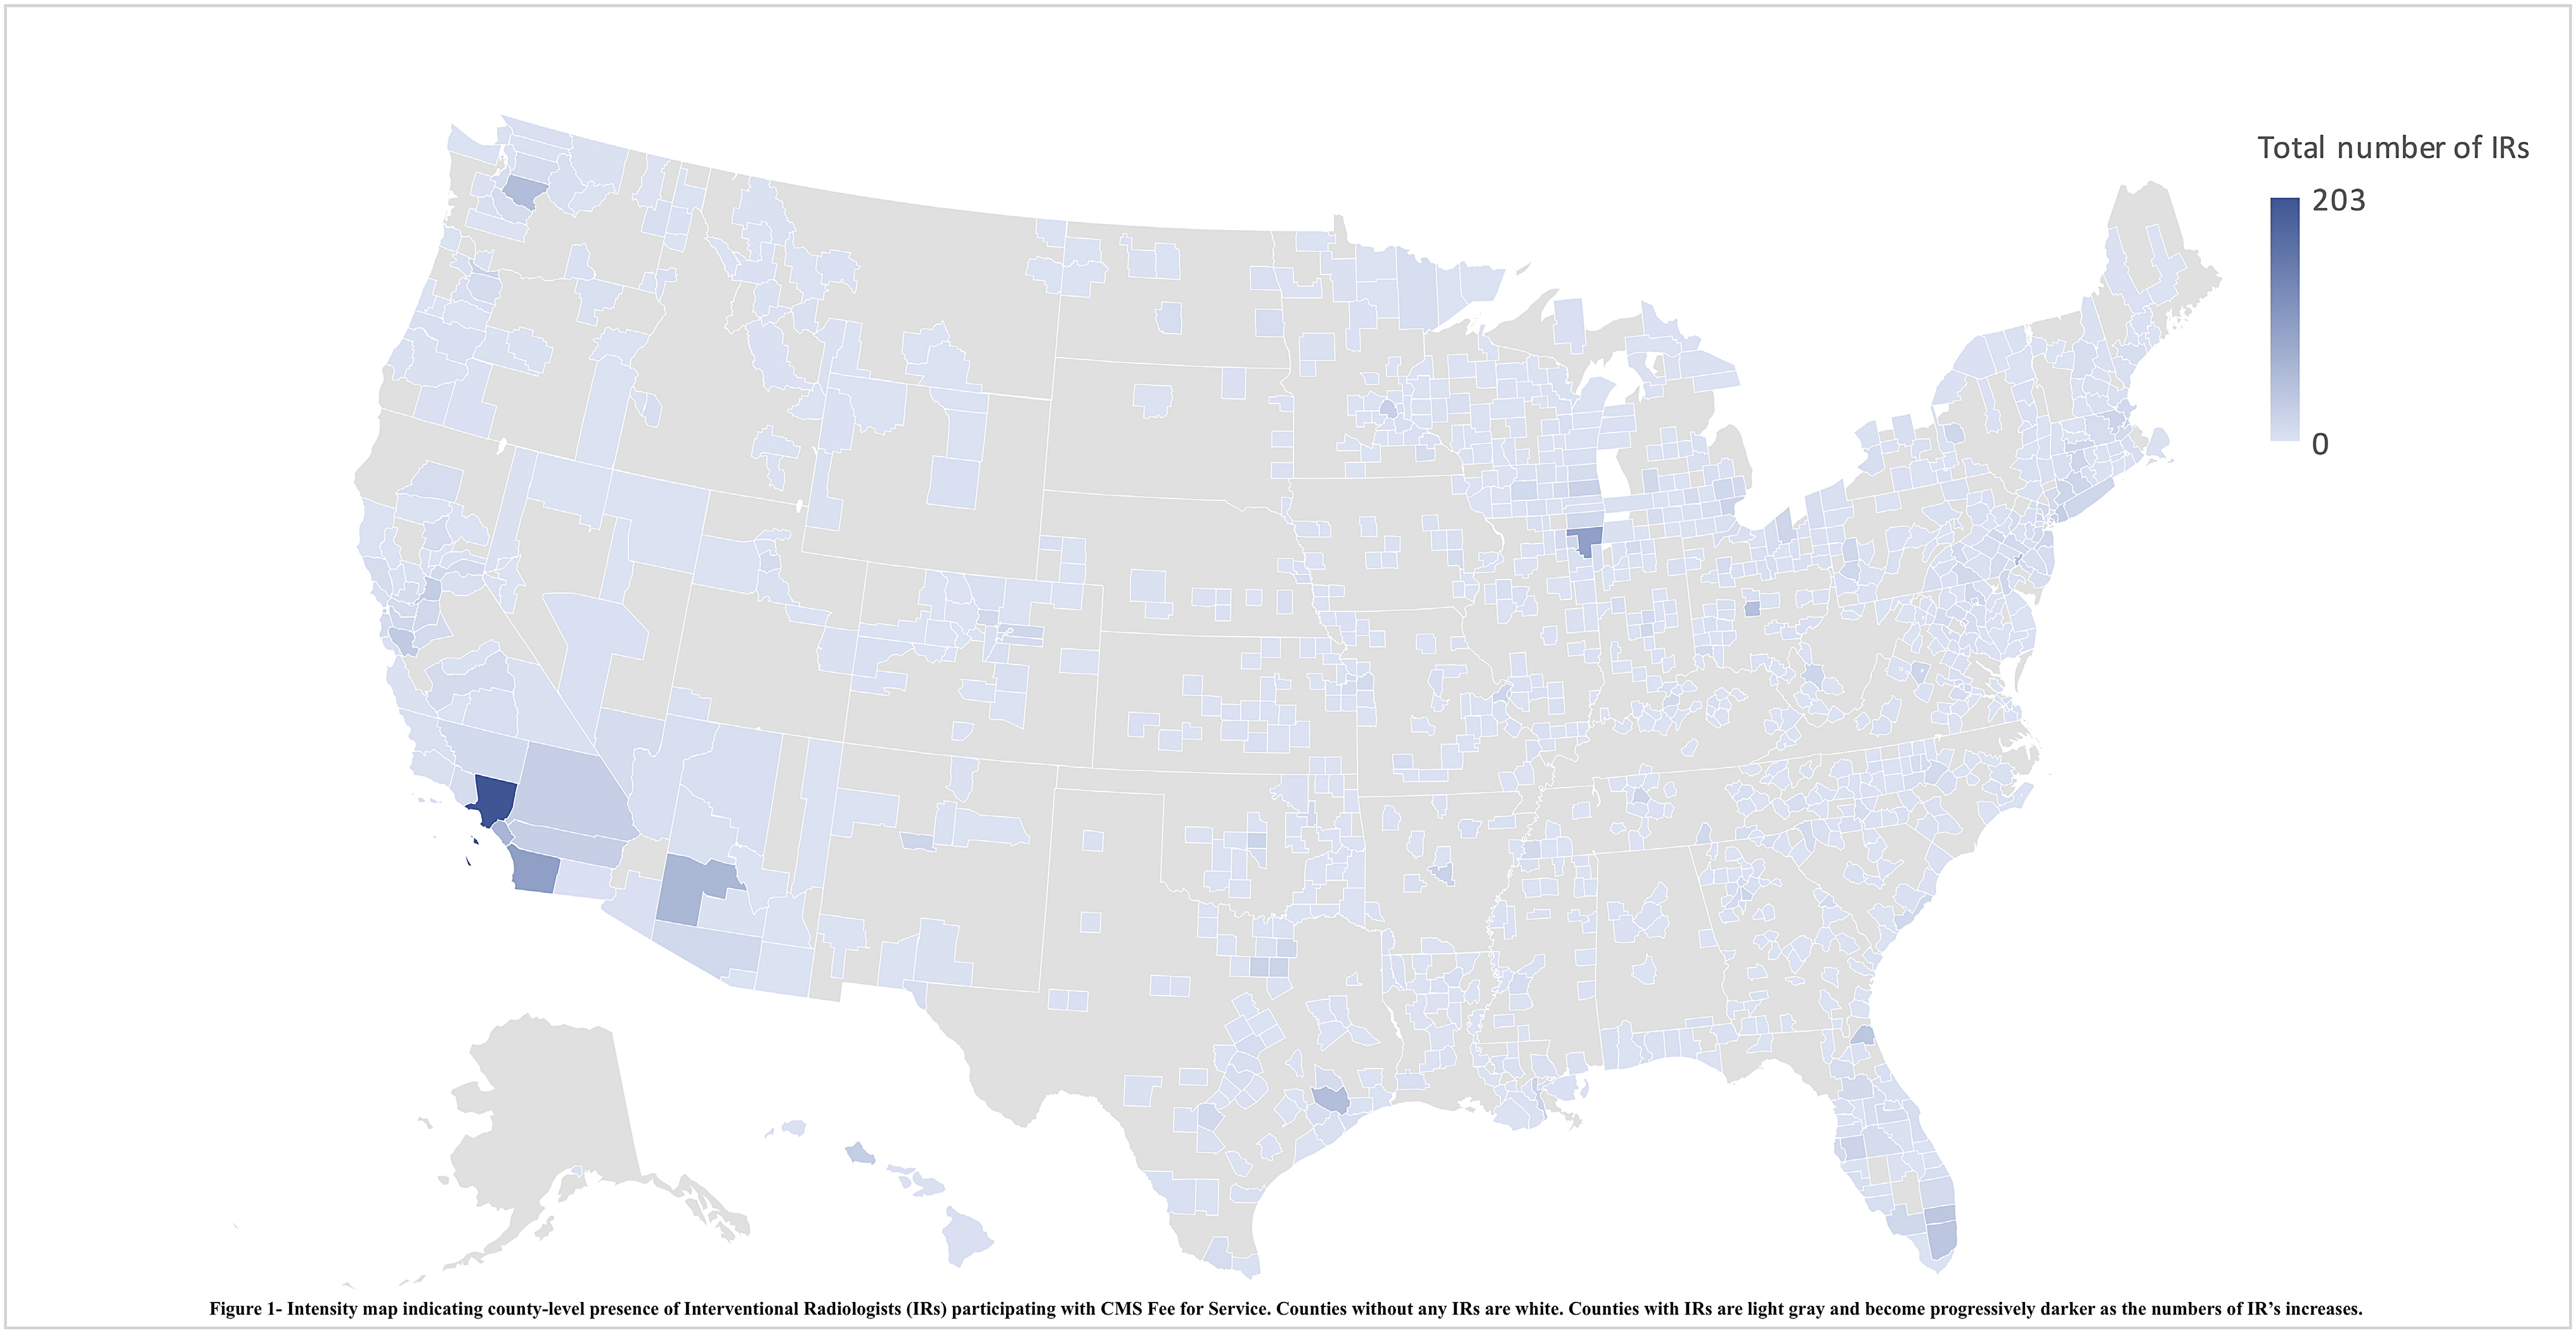
The final data were tabulated on Excel™ to extract predetermined metrics for each county category: rural, urban, and metropolitan. Specifically, IR density per 100 000 people, total population, and the total number of IRs for all 3 county types was calculated. A visual representation of IR density was created showing the frequency of IRs in each county across the United States (Figure 1).
Results
There are a total of 3142 counties in the United States. Among them, 1166 (37.1%) are metropolitan counties, 1332 (42.4%) are urban counties, and 644 (20.5%) are rural counties. In the first quarter of 2018, there were a total of 4179 IRs practicing in 1112 (35.4%) counties across the United States, potentially providing service to 262.7 million people (80.3%).
The remaining 2029 (64.6%) counties did not have practicing IRs. Of those 2029 counties, 485 (23.9%) are considered metropolitan, 957 (47.2%) are urban, and 587 (28.9%) are rural. The total combined populations of counties without IRs present are approximately 30.0 million people, 29.3 million people, and 5.1 million people for metropolitan, urban, and rural counties, respectively.
Of the total IRs, 3762 practiced in metropolitan counties and 375 (9.0%) in urban counties. The remaining 41 (1.0%) IRs practiced in rural counties. There is an overall density of 1.28 IRs per 100 000 people nationwide. Metropolitan counties have an overall density of 1.37 IRs per 100 000. Urban and rural counties have overall densities of 0.81 and 0.57 IRs per 100 000, respectively.
Discussion
Previous data showed that IRs tend to be unevenly distributed across the United States and that this unequal distribution tends to worsen when analyzed at the region level.6 This study builds on the previous data and shows that the IR workforce is highly concentrated in metropolitan counties. In fact, the overwhelming majority (90%) practice in metropolitan counties while rural counties only have 1% of the total IRs. This disparity continues to exist even when controlled for population size. In metropolitan areas, there are 1.37 IRs per 100 000 people, while in urban and rural counties there are 0.81 and 0.57 interventional radiologists per 100 000, respectively. Unfortunately, there currently is no ideal number of IRs for the United States population. While the number of IRs needed is unclear, the data undeniably shows a disparity between metropolitan and urban/rural counties. Therefore, it is imperative to develop solutions that increase IRs’ presence in underserved areas.7
To address the unequal distribution, we proposed a range of solutions. The ideal solution is to have IRs start or join practices in less densely populated regions. This would provide urban/rural areas with direct access to IRs and would significantly reduce the logistical burden of transferring to hospitals in other regions. Financial feasibility is often a top concern among physicians and hospitals looking to expand their practices. One potential model for urban/rural-based practice could be for IRs to participate in teleradiology while partnering with local physicians, especially in primary care. Given the diverse conditions and the versatility of procedures IRs can perform, partnering with primary care providers would provide a consistent source of procedures and imaging which can be supplemented by participating in teleradiology services.
While a model where IRs partner with primary care providers appears to be a viable option when paired with teleradiology, the fact that urban/rural areas are traditionally less desirable compared to metropolitan areas may be difficult to overcome. This issue is not unique to IR and a disparity between densely populated vs. less densely populated areas has been well documented among various specialties not only in the United States8-10 but also internationally.11 Furthermore, hospitals in urban/rural areas have specifically demonstrated a difficulty in attracting or maintaining IRs.12 The difficulty of attracting physicians to less populous regions is intrinsic to the areas and therefore nearly impossible to overcome. Barriers such as limited resources, professional and social isolation, significant others being unable to find fulfilling jobs, less control over work hours, and fewer cultural amenities are some factors that dissuade practice in urban/rural areas.13 One potential way to address this issue is to continue investing in medical students and trainees interested in serving rural populations. Many schools and training programs have attempted to increase the number of trainees interested in rural care by either recruiting trainees from underserved areas or catering education to trainees who are interested. Additionally, with the development of the new integrated residency program, it will be important to educate medical students about the field of interventional radiology to increase interest.
Although it is important to continue investing in trainees, this method is unlikely to attract enough candidates to address the disparity gap. Therefore, it is also important to invest in alternative systems to provide care for these populations. This includes training primary care providers about the utility of IRs, developing transport systems for patients who need IR services, and investing in technology such as telehealth to reduce the need for physical presence of physicians. While further studies are needed to analyze the best way to deploy resources—including characterizing other specialties that overlap with IR services—and the impact on future practice, the visual representation of IRs’ geographic distribution will give policymakers and experts a macro-level understanding of which areas should be targeted.
It should be noted that while reliable, the study design has some limitations. First, the PCDNF database relies on self-reported billing ZIP codes. Therefore, if a physician lists practices in multiple ZIP codes or counties, then it was assumed that the physician spent equal time at each location. Furthermore, it is possible that not all practice ZIP codes are being reported to the PCDNF database. For example, group practices that cover multiple counties may bill CMS from the main practice billing ZIP code. The second limitation is that the CMS provider specialty codes used to identify IRs are self-reported; this study only includes physicians who identify as IRs as a primary specialty or diagnostic radiologists who list IR as a secondary specialty. However, it is possible that non-radiologists who perform catheter-based interventions may list “interventional radiology” as a primary specialty. Despite the limitations, since CMS is the most common entity that providers submit claims to, this method is the best available way of identifying and characterizing the distribution of IRs.
Conclusion
In conclusion, the data show there is an unequal distribution of IRs between metropolitan and rural/urban areas. Ideally, organizations would find ways to attract IRs to practice in these underserved areas. However, given some of the intrinsic barriers, it is not practical to expect that this method alone will be sufficient. Therefore, investing in alternative systems to provide access and care is vital in improving the health of the population. The map developed using the data in this study can be a useful tool that policymakers and experts use to target policies and funding.
Figures
Tables
| Code | Description |
|---|---|
| 1 | Counties in metro areas of 1 million population or more |
| 2 | Counties in metro areas of 250 000 to 1 million population |
| 3 | Counties in metro areas of fewer than 250 000 population |
| 4 | Urban population of 20 000 or more, adjacent to a metro area |
| 5 | Urban population of 20 000 or more, not adjacent to a metro area |
| 6 | Urban population of 2500-19 999, adjacent to a metro area |
| 7 | Urban population of 2500-19 999, not adjacent to a metro area |
| 8 | Completely rural or less than 2500 urban population, adjacent to a metro area |
| 9 | Completely rural or less than 2500 urban population, not adjacent to a metro area |
Declarations
- Ethics Committee Approval
- This study was exempt from Institutional Board Review approval.
- Peer Review
- Externally peer-reviewed.
- Author Contributions
- Concept - V.K.P., S.G.P.; Design - V.K.P., S.G.P., J.L.B.; Supervision - A.N.B., G.S.G., A.S.; Resources - V.K.P., S.G.P.; Materials - V.K.P., S.G.P., J.L.B.; Data Collection and/or Processing - V.K.P., S.G.P., J.L.B.; Analysis and/or Interpretation - V.K.P., S.G.P., J.L.; Literature Search - V.K.P., S.G.P.; Writing Manuscript - V.K.P., S.G.P.; Critical Review - All authors.
- Declaration of Interests
- The authors declare that they have no competing interest.
- Funding
- This study received no funding.
References
- Medicare enrollment dashboard. Centers for Medicare & Medicaid Services [internet]. Available at: https://www.cms.gov/Research-Statistics-Data-and-Systems/Statistics-Trends-and-Reports/CMSProgramStatistics. Accessed November 13, 2019.
- Bender CE, Bansal S, Wolfman D, Parikh JR. ACR commission on human resources workforce survey. J Am Coll Radiol. 2018:16(4); 508-512.
- HUD United States Postal Service. ZIP code crosswalk files | HUD USER [internet]. Available at: https://www.huduser.gov/portal/datasets/usps_crosswalk.html. Accessed November 7, 2019.
- County FIPS Codes, NRCS [internet]. Available at: https://www.nrcs.usda.gov/wps/portal/nrcs/detail/national/home/?cid=nrcs143_013697. Accessed November 7, 2019.
- United States Department of Agriculture, economic research service. Rural-urban continuum codes [internet]. Available at: https://www.ers.usda.gov/data-products/rural-urban-continuum-codes.aspx. Accessed November 7, 2019.
- Hunt S, Silk M, Sprinkle J, Nadolski G, Gade T, Hillier A. Geospatial mapping of interventional radiology physician density. J Vasc Interv Rad. 2017;28(2):S156. [CrossRef]
- Rosenkrantz AB, Hughes DR, Duszak R, The US. The U.S. Radiologist workforce: an analysis of temporal and geographic variation by using large national datasets. Radiology. 2016;279(1):175-184. [CrossRef]
- Glazer AM, Farberg AS, Winkelmann RR, Rigel DS. Analysis of trends in geographic distribution and density of US Dermatologists. JAMA Dermatol. American Medical Association. 2017;153(4):322-325. [CrossRef]
- Aneja S, Ross JS, Wang Y, et al. US cardiologist workforce from 1995 to 2007: modest growth, lasting geographic maldistribution especially in rural areas. Health Aff (Millwood). 2011;30(12):2301-2309. [CrossRef]
- Lango MN, Handorf E, Arjmand E. The geographic distribution of the otolaryngology workforce in the United States. Laryngoscope. 2017;127(1):95-101. [CrossRef]
- Matsumoto M, Inoue K, Farmer J, Inada H, Kajii E. Geographic distribution of primary care physicians in Japan and Britain. Health Place. 2010;16(1):164-166. [CrossRef]
- Friedberg EB, Corn D, Prologo JD, et al. Access to interventional radiology services in small hospitals and rural communities: an ACR membership intercommission survey. J Am Coll Radiol. 2019;16(2): 185-193. [CrossRef]
- Nakayama DK, Hughes TG. Issues that face rural surgery in the United States. J Am Coll Surg. 2014;219(4):814-818. [CrossRef]
Cite this article
Vamsi K. Potluri, Shaunak G. Patel, Josh L. Bilello, Gunvir S. Gill, Arsalan Saleem, Arya N. Bagherpour. The Geographic Distribution of Interventional Radiologists in the United States: A County-Level Analysis. Imaging and Intervention. 2022;2(1):1–4. doi:10.5152/iai.2022.21025
Related articles
- Case ReportPDFEndovascular Retrieval after Migration of Nexplanon® in a Subsegmental Pulmonary Artery: Case Report
- Case ReportPDFAberrant Internal Carotid Artery: An Unusual Anatomic Variant
- Original ArticlePDFCan Chest X-Ray Findings Predict the Prognosis, Clinical Outcome, and Mortality in Serologically Confirmed COVID-19 Patients?